Debugging HTTP traffic like a boss
One can simply use tcpdump (or Wireshark):
$ tcpdump -ttt -A -q -l 'tcp port 80 or tcp port 443'
If you are looking for more convenient way of viewing HTTP traffic you can use
following quick n’ dirty python script, which requires only python-flask and
python-requests libraries
#!/usr/bin/python
# -*- coding: utf8 -*-

import requests
from flask import Flask
from flask import Response
from flask import request


app = Flask(__name__)


@app.route('/<path:url>', methods=['POST', 'GET', 'PUT', 'DELETE'])
def proxy(url):

    def print_dict(direction, data):
        for (key, val) in data.iteritems():
            print("{0} {1}: {2}".format(direction, key.title(), val))

    print("> {0} {1}".format(request.method, url))
    print_dict('>', request.form)

    req = requests.request(request.method, url, data=request.form)

    print("< Status code {0}".format(req.status_code))
    print_dict('<', req.headers)
    print(req.content)

    return Response(req.content), req.status_code

if __name__ == '__main__':
    app.run(debug=True)
It will forward all requests to URL specified as a path, e.g.
$ curl http://127.0.0.1:5000/http://httpbin.org/ip
will forward GET request to http://httpbin.org/ip and display the following
debug output
> GET http://httpbin.org/ip
< Status code 200
< Content-Length: 31
< Server: nginx
< Connection: keep-alive
< Access-Control-Allow-Credentials: true
< Date: Mon, 11 May 2015 21:34:17 GMT
< Access-Control-Allow-Origin: *
< Content-Type: application/json
{
  "origin": "192.0.2.128"
}
Of course this script is buggy as hell - it cannot even forward GET parameters…
mitmproxy to the rescue!
mitmproxy in an interactive console program that allows traffic flows to be intercepted, inspected, modified and replayed. After installation bring it up
$ mitmproxy
and configure proxy for your client, e.g.
$ curl -x http://localhost:8080 http://httpbin.org/ip
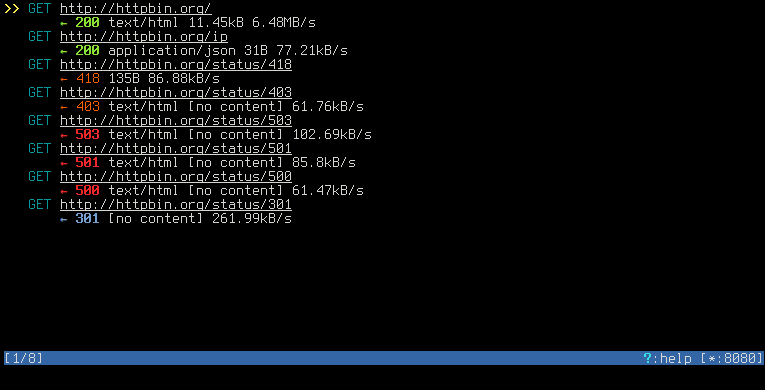
You should see a nice list of all your requests in mitmproxy window
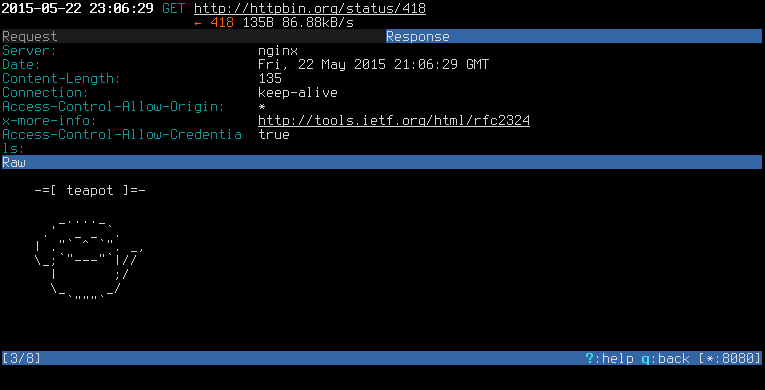
after selecting a request press Enter to view the details
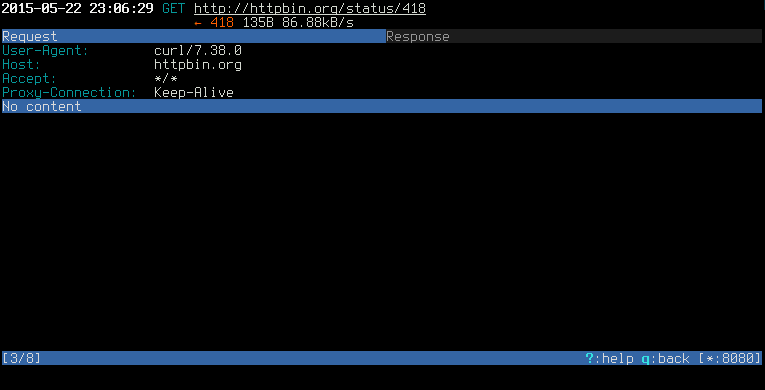
and Tab to navigate between Request and Response
It’s worth mentioning, that mitmproxy can also work in transparent mode.
Other tools
I’ve also used following tools while playing with HTTP traffic:
- Burp Suite - free edition includes Burp Proxy for traffic monitoring,
- Fiddler - web debugging proxy written in .NET (it should work on GNU/Linux too!).